


If you’re running a website and not tracking your SEO, you’re missing out on critical insights. The good news? You don’t need to spend a cent. Free tools like Google Search Console, Google Analytics 4, and PageSpeed Insights give you everything you need to monitor your site’s performance. Here’s what you should focus on:
- Key Metrics: Organic traffic, keyword rankings, click-through rates (CTR), Core Web Vitals, and indexing status.
- Setup Basics: Google Search Console tracks how users find your site, while Google Analytics 4 helps you understand visitor behaviour. PageSpeed Insights evaluates site speed and usability.
- Ongoing Monitoring: Schedule weekly checks for indexing errors, traffic trends, and technical issues. Use tools like Ubersuggest for audits and Google Keyword Planner for keyword research.
- Reporting: Use Looker Studio to create easy-to-read dashboards that combine data from multiple tools.
Start small, follow an SEO checklist, and let the data guide your next steps. With just a few minutes each week, you can improve your site’s visibility and performance without spending a rand.
Set up THESE 3 Free Google Tools to Help Your SEO (as a Small Business Owner)
sbb-itb-6f8605a
Setting Up Your Free SEO Tools
Complete SEO Tracking Setup Guide: 3 Essential Free Tools
You can set up free SEO tools using your Google account. These tools are essential for gaining a full understanding of your website’s SEO performance, a core component of our digital marketing services. Here’s a guide to configuring the three main tools.
How to Set Up Google Search Console
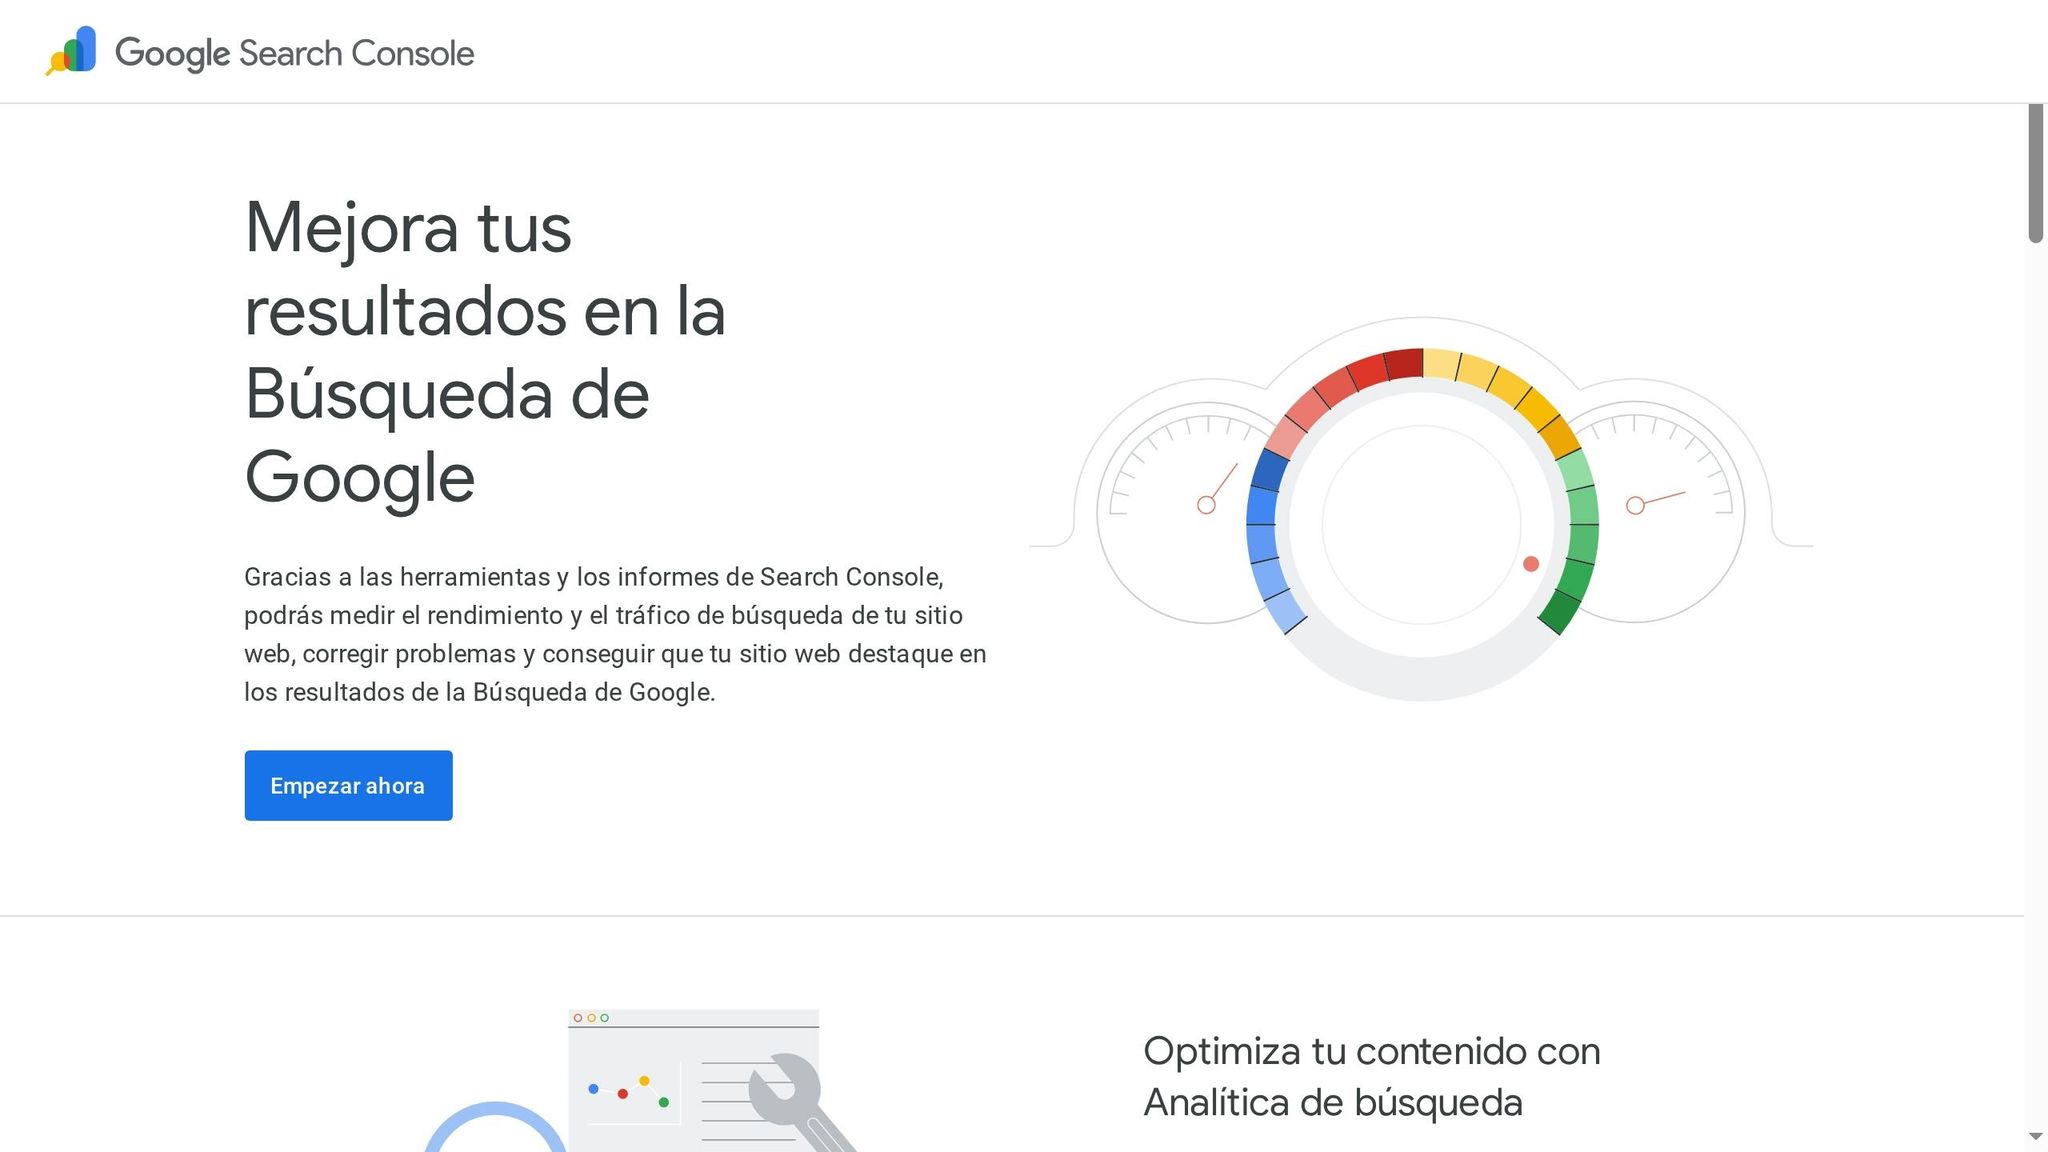
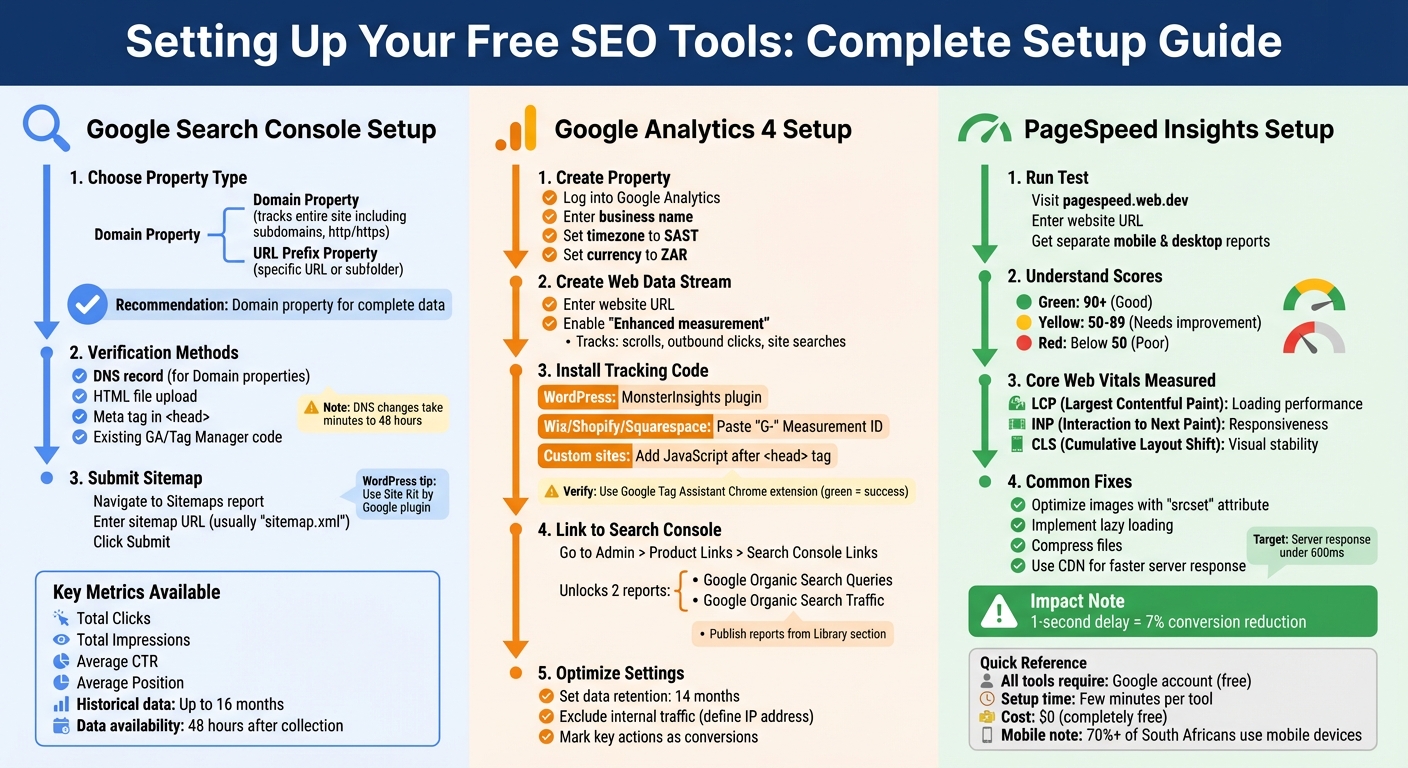
Google Search Console (GSC) is your go-to tool for understanding how Google views your website. You have two property options: Domain property, which tracks everything across your site (including subdomains and both http and https versions), or URL Prefix property, which focuses on a specific URL or subfolder. For South African businesses, the Domain property is ideal, as it provides a complete data set for your site.
Verification is simple. For Domain properties, use the DNS record method. Google will provide a TXT record, which you’ll need to paste into your domain registrar’s DNS settings. For URL Prefix properties, you have more options – upload an HTML file to your root directory, add a meta tag to your homepage’s <head> section, or use existing Google Analytics or Tag Manager code. Note that DNS changes can take anywhere from a few minutes to 48 hours to fully propagate.
Once verified, submit your sitemap to help Google crawl your pages efficiently. Go to the Sitemaps report on the left-hand menu, enter your sitemap URL (usually "sitemap.xml"), and click "Submit." If you’re using WordPress, the Site Kit by Google plugin simplifies this process and even lets you view metrics directly in your dashboard.
"The beauty of GSC is that it doesn’t just show you what’s happening on your site, it shows you how people are finding it." – Tanatswa Chingwe, Writer, Search Engine Land
GSC provides up to 16 months of historical data, with reports becoming available around 48 hours after data collection. You’ll have access to metrics like Total Clicks, Total Impressions, Average CTR, and Average Position – essential for tracking your site’s performance.
Next, move on to setting up Google Analytics 4 to dive deeper into visitor behaviour.
How to Set Up Google Analytics 4
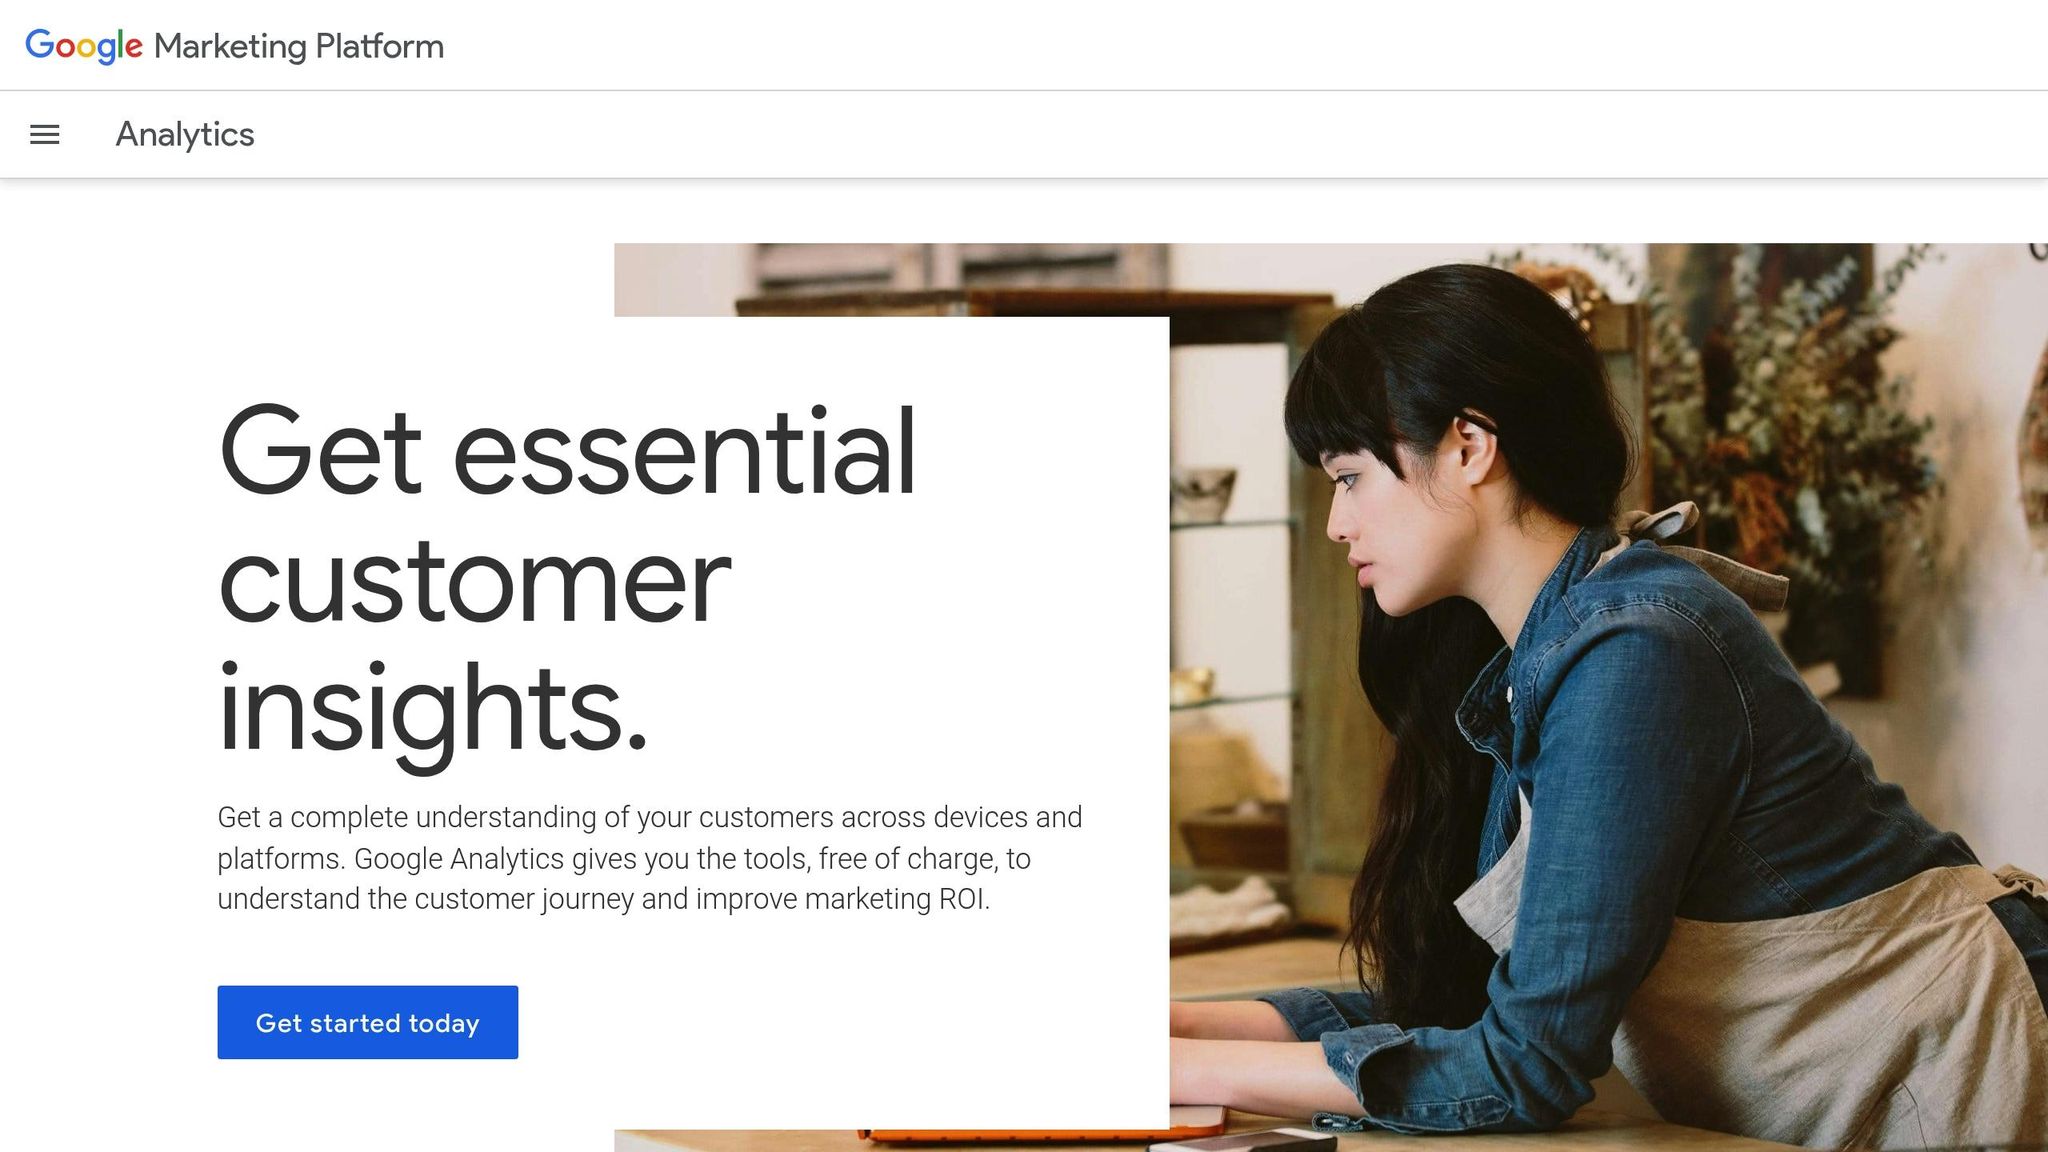
Google Analytics 4 (GA4) focuses on what happens after visitors arrive on your site. To get started, log into Google Analytics, create an account, and set up a GA4 property. Be sure to enter your business name, set the reporting time zone to SAST, and use ZAR for currency. Then, create a Web data stream by entering your website URL and enabling "Enhanced measurement", which automatically tracks actions like scrolls, outbound clicks, and site searches.
Installation varies depending on your platform. For WordPress, the MonsterInsights plugin makes things simple. Platforms like Wix, Shopify, and Squarespace allow you to paste your "G-" Measurement ID into their analytics fields. If you’re working on a custom-built site, add the JavaScript snippet directly after the <head> tag. Use the Google Tag Assistant Chrome extension to confirm the setup – a green icon indicates success.
For deeper insights, link your GSC property to GA4. In GA4, go to Admin > Product Links > Search Console Links to connect the two. This unlocks two powerful reports: Google Organic Search Queries, which shows the keywords driving traffic, and Google Organic Search Traffic, which highlights your top-performing landing pages. These reports are unpublished by default, so head to the Library section to make them visible.
Before analysing your data, adjust your settings. Set data retention to 14 months (Admin > Data Settings > Data Retention), exclude internal traffic by defining your IP address, and identify key user actions (like form submissions) in the Events list. Mark these actions as conversions to better understand how organic traffic supports your business goals.
How to Use PageSpeed Insights
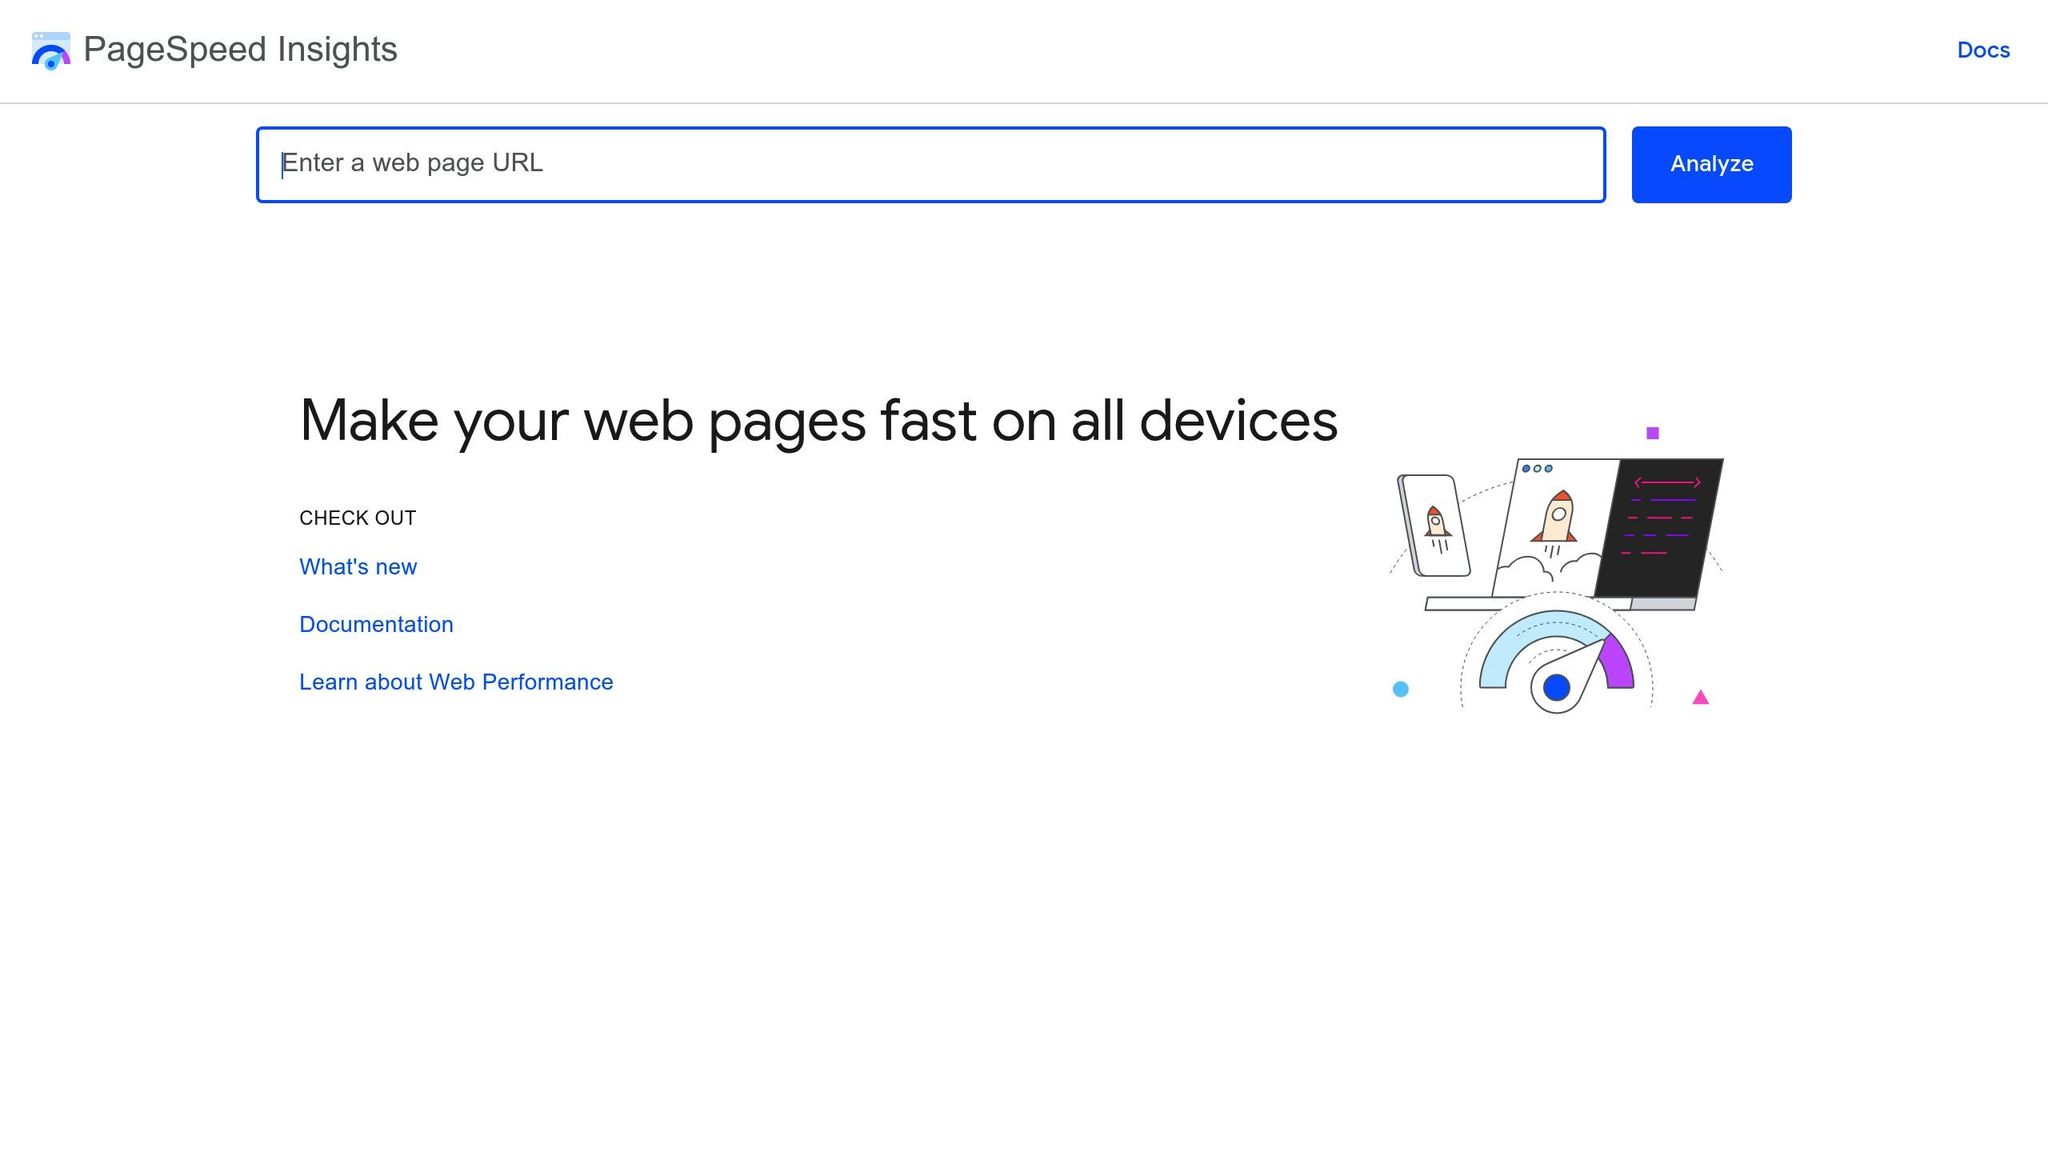
PageSpeed Insights (PSI) is a tool for measuring how quickly your site loads and how well it performs. These factors directly impact your search rankings. To use it, visit pagespeed.web.dev and enter your website’s URL. You’ll get separate performance reports for mobile and desktop versions.
PSI scores fall into three categories: green (90+), yellow (50–89), and red (below 50). The score is based on Core Web Vitals, which include:
- Largest Contentful Paint (LCP): Measures loading performance.
- Interaction to Next Paint (INP): Tracks responsiveness.
- Cumulative Layout Shift (CLS): Monitors visual stability.
Mobile scores are often lower than desktop ones due to differences in device processing power and network conditions.
Below your score, PSI highlights technical issues and suggests "opportunities" to improve performance, including estimated time savings. Common fixes include optimising images with the "srcset" attribute, implementing lazy loading for off-screen content, and compressing files to reduce load times. Improving server response times is another key step – consider using a Content Delivery Network (CDN) or upgrading your hosting plan, especially if your server response time exceeds 600 milliseconds.
"There’s no need to obsess over the 100 score since it’s nearly impossible to reach for all pages. It’s best to focus on better user experience and relevance." – Mari Skula, Chief of Content & Business Operations Manager, Magefan
PSI insights complement your analytics by highlighting areas to enhance the user experience. Regularly running PageSpeed tests should be part of your SEO routine. While the PSI score itself isn’t a direct ranking factor, the underlying metrics – like speed and usability – are crucial. Even a 1-second delay in page performance can reduce conversions by 7%.
Analysing Your SEO Performance
Once your tools are set up, the next step is making sense of the data to improve your SEO results. This process connects the initial setup to ongoing adjustments, helping you identify traffic-driving keywords, uncover technical issues, and monitor your search rankings over time. These insights are crucial for keeping your strategy on track.
Finding Keywords with Google Keyword Planner
After configuring your tools, the focus shifts to identifying the right keywords. Google Keyword Planner is a powerful resource for uncovering valuable search terms. Accessible through your Google Ads account (billing details are required, even if you don’t run active campaigns), the tool offers two main options:
- "Discover new keywords": Enter your domain or a specific page URL, and Google will analyse your content to suggest relevant keywords.
- "Get search volume and forecasts": Upload a list of keywords you’re already tracking to review their current performance.
For better localisation, adjust the location filter to South Africa. This lets you see search volume and reach specific to the local market. The tool provides metrics like "Average monthly searches" and "Top of page bid (high range)", which can hint at keywords with strong conversion potential. Targeting these keywords organically can help you save on Google Ads spend. Additionally, competition levels (Low, Medium, or High) guide you to opportunities where search volume is high but competition is manageable.
"The benefit of using Google Keyword Planner for keyword research is that it is free and uses Google data." – Search Engine Journal
Keep an eye on the "Three-month change" and "YoY change" columns to identify trending or seasonal keywords. Use the "Refine keywords" panel to filter out branded terms or narrow down results based on specific attributes like service types. This helps you fine-tune your keyword strategy efficiently. Remember, forecasts refresh daily and account for seasonal trends using data from the past 7–10 days.
Running SEO Audits with Ubersuggest
To identify and fix technical issues that could be dragging down your site’s performance, Ubersuggest offers a free SEO Analyzer. Simply input your domain to generate a detailed report, which includes an overall SEO health score.
The audit highlights problems like broken meta tags, slow page speeds, and indexing errors, along with step-by-step guidance on fixing them. It also includes a site speed analysis to check if your site meets Google’s performance benchmarks. Additionally, the backlink overview helps you assess how authority is distributed across your site.
Given that more than 70% of South Africans access websites via mobile devices, addressing mobile-friendliness issues flagged in the report should be a priority. Creating a free Ubersuggest account unlocks features like weekly rank tracking and customised recommendations. Regular audits can catch issues like 404 errors before they affect your rankings, keeping your site in good shape.
Once your site’s technical health is optimised, you can focus on how these adjustments impact your keyword rankings.
Monitoring Keyword Rankings in Google Search Console
Google Search Console’s Performance report is a vital tool for tracking your site’s visibility in search results. Enable the "Average Position" and "Average CTR" cards to access detailed ranking metrics. The Average Position metric reflects the highest ranking of your site for a given query – if your pages rank at positions 2, 4, and 6, the tool records position 2.
For tracking specific keywords, use the + NEW filter, select "Query", and enter your target term to monitor its ranking trends over time. Alternatively, switch to the PAGES tab, select a URL, and return to the QUERIES tab to see every keyword that page ranks for. To measure progress, use the Date filter to compare the last three months against the previous period.
Focus on queries with an average position between 11 and 20 – these are second-page keywords that might only need small tweaks to push them to page one. Since the interface only displays the top 1,000 queries, exporting the data is essential for a more comprehensive analysis.
"A safer bet is to aim for position 10 or lower, and to try not to drop in position over time. In general, you should focus more on impressions and clicks than on position." – Google Search Central
These insights close the loop on data analysis, helping you refine your SEO strategy and drive better results over time.
Creating Visual Reports with Looker Studio

After analysing your SEO data, the next step is presenting it in a way that’s easy to understand. Looker Studio (previously Google Data Studio) is a free tool that turns raw data into dynamic, auto-updating dashboards. Instead of wading through endless spreadsheets, you can view traffic trends, keyword rankings, and conversion data in clear, interactive charts and graphs. This process transforms your analysis into insights you can act on.
Looker Studio integrates seamlessly with Google tools, so there’s no need for manual data entry or file uploads. Bruce Clay, Founder and President of Bruce Clay Inc., highlights its adaptability:
"Looker Studio’s flexibility to ingest data from any source allows SEOs and agencies to adapt their reporting to highlight new data points of interest when they need it."
This means you can create a single dashboard that consolidates metrics like organic clicks, keyword performance, and device data – all in one place.
How to Build Custom Dashboards
To get started, log into Looker Studio and create a Blank Report. Begin by connecting Google Search Console. Click Create > Data Source, then select the Search Console connector, authorise access, pick your site, and choose a table type. For most dashboards, the URL Impression option works best, as it lets you filter data by specific pages or posts. Next, select your Search Type (e.g., Web, Image, Video) and click Connect.
Once Search Console is linked, add Google Analytics 4 by clicking Add Data and choosing the Google Analytics connector. Select your account and property, then click Add. By combining data from Google Search Console and Google Analytics 4, you can build a report that merges key metrics. Use Scorecards to highlight figures like organic clicks and click-through rates (CTR), Time Series Charts to monitor traffic trends, and Tables to display keyword rankings with dimensions like "Query" and "Landing Page." The Blend Data feature allows you to merge Search Console and GA4 data, so you can see how search rankings align with conversions.
Adam Tanguay, Head of Growth at Jordan Digital Marketing, shares:
"The Looker Studio dashboard has been a game-changer for my team… it provides a clear live view of SEO traffic over time, with the ability to segment data."
For a polished look, set up filters to exclude null values in the "Query" dimension – Google leaves these blank to protect low-volume search terms. You can also add a drop-down filter for "Search type" so users can toggle between web, image, video, and news data. Finally, use the responsive layout option to ensure your dashboard looks professional across devices like mobiles, tablets, and desktops.
Once your dashboard is ready, the next step is sharing it with your team.
How to Share Reports with Your Team
To share your dashboard, click the Share button in the top-right corner. Enter the email addresses or Google Groups of your team members, and assign permissions as either Can view or Can edit. If you choose Owner’s Credentials, team members can view the data without needing their own access to Google Search Console or Analytics – ideal for sharing reports with clients or stakeholders. Alternatively, Viewer’s Credentials requires each person to have access to the underlying data sources.
Looker Studio also makes it easy to automate report sharing. You can schedule weekly or monthly PDF reports to be emailed directly to stakeholders. Since Looker Studio pulls in the latest data automatically, your reports stay up-to-date without any extra effort. This ensures your team can monitor progress and identify trends as they happen.
How to Monitor SEO Performance Regularly
Once your tools are set up and you’ve completed your initial analysis, the next step is consistent monitoring. This ensures your SEO efforts continue to deliver results over time.
Skipping regular SEO checks can result in missed problems that harm your website’s performance. Frequent monitoring allows you to address issues early, identify new opportunities, and prove the value of your work. Mateusz Makosiewicz, a Marketing Researcher at Ahrefs, puts it this way:
"Monitoring key aspects of SEO is important because it allows you to react to things that can impact your visibility in search engines, such as declining keyword rankings."
The trick is to establish a manageable routine. Weekly checks focus on immediate concerns, like indexing errors or sudden traffic drops, while monthly reviews help you track overall trends and refine your strategy. By sticking to a regular schedule, you can keep your SEO efforts aligned and effective.
Your Weekly SEO Monitoring Checklist
Start your week by diving into Google Search Console. Check the "Indexing" report for errors. If multiple pages show similar issues, it could indicate a broader technical problem affecting your site.
Next, head to the "Performance" report to compare clicks and average rankings with the previous week. A sudden traffic drop might point to technical glitches or algorithm changes, while a gradual decline could mean competitors are gaining an edge. Keep an eye on your best-performing pages – if their performance slips, investigate the cause immediately.
For technical health, use Ahrefs Webmaster Tools to run a weekly crawl. You can set up email alerts to get notified about new issues as they arise.
Don’t forget to check your backlink profile in the "Referring Domains" report. A steady increase in backlinks shows that your content is building authority, while a decline might signal broken links or lost mentions. Lastly, review Core Web Vitals under the "Mobile Usability" report to ensure your site remains fast and easy to use on mobile devices.
| Task | Tool | What to Check |
|---|---|---|
| Indexing Errors | Google Search Console | Pages excluded from search and reasons why |
| Traffic Trends | Google Search Console | Weekly clicks and impressions |
| Technical Issues | Ahrefs Webmaster Tools | 404 errors, server issues, missing metadata |
| Backlinks | Ahrefs Webmaster Tools | New and lost referring domains |
| Site Speed | PageSpeed Insights | Core Web Vitals for top pages |
In addition to these weekly checks, summarising your findings for stakeholders is equally important.
How to Create Reports for Stakeholders
When reporting to stakeholders, focus on how SEO is driving business results rather than overwhelming them with every metric. Use tools like Google Analytics 4 and Google Search Console to compile clear, concise reports. Start with an executive summary that highlights key results in simple terms. For example, instead of just saying "Traffic increased by 20%", explain what that growth means in terms of actual visitors or conversions.
Track important actions like form submissions, newsletter sign-ups, or purchases in Google Analytics 4. Then, use a live Looker Studio dashboard to integrate data from Google Search Console. This allows stakeholders to monitor progress whenever they want .
A well-structured report should include three main sections:
- Executive Summary: Highlight major outcomes.
- Opportunities for Improvement: Pinpoint areas to address.
- Roadmap: Summarise past achievements and outline future priorities.
For remote teams or clients, consider using Google Slides to create monthly presentations that walk through your findings step-by-step. This approach makes it easier to communicate progress and keep everyone aligned.
Conclusion
When it comes to SEO tracking, you don’t need to break the bank. As Louis Pretorius wisely points out:
"Tracking your SEO progress doesn’t require complicated or expensive software. With a handful of free tools and a few minutes each week, you can gain valuable insights into what’s working and where you need to improve."
These free tools level the playing field, giving smaller businesses access to the same type of data that larger companies rely on. By conducting weekly checks, you can quickly address immediate issues, while monthly reviews help you spot long-term trends and opportunities. This approach not only allows you to respond to declining rankings before they hit your bottom line, but also helps demonstrate ROI to stakeholders .
SEO isn’t a quick fix – it’s a long-term game. By sticking to a manageable routine and using visual dashboards to centralise your data, you can track your progress, see what’s working, and pivot your strategy based on real results rather than guesswork. Chris Haines, an SEO Director, reinforces this idea, noting that effective SEO reporting is entirely possible with free tools.
Start simple, stay consistent, and let the data guide your next steps. With this steady, data-driven approach, you’ll gradually improve your website’s SEO performance.
FAQs
How can I verify ownership of my website in Google Search Console?
To verify your website in Google Search Console, the first step is confirming ownership of the site. Begin by logging into Google Search Console with your Google account and adding your site as a property. After that, pick a verification method that suits you best. Options include adding an HTML tag to your site’s code, uploading an HTML file, or using tools like Google Analytics or Google Tag Manager.
Once you’ve applied your chosen verification method, head back to Search Console and click Verify. If everything is correctly configured, your site will be verified, granting you access to important performance data. Keep in mind that verification methods can differ based on your website platform, so it’s a good idea to follow any platform-specific guidelines provided.
What are Core Web Vitals, and why do they matter for your website?
Core Web Vitals are a set of metrics that gauge how well a website delivers a smooth and enjoyable experience to its users. These metrics focus on three main aspects: loading speed, interactivity, and visual stability. Here’s a quick breakdown:
- Largest Contentful Paint (LCP): Tracks how quickly the main content of a page loads.
- First Input Delay (FID): Measures the time it takes for a page to respond to a user’s first interaction.
- Cumulative Layout Shift (CLS): Looks at how stable the page layout is as it loads, ensuring elements don’t unexpectedly move around.
These metrics matter because they directly affect how users perceive your site. A page that loads slowly, reacts sluggishly, or shifts content unexpectedly can frustrate visitors, leading to higher bounce rates and fewer conversions. And let’s not forget: search engines pay attention to these factors when ranking websites.
The good news? Tools like Google Search Console and PageSpeed Insights make it easy to monitor these metrics. By identifying and addressing performance issues, you can improve both your SEO and the browsing experience for your audience. A fast, stable website builds trust and keeps visitors engaged – key ingredients for online success.
How can I monitor keyword performance for free?
Tracking how your keywords are performing is easy with free tools like Google Search Console. First, create an account and verify that you own your website. Once this is done, head to the Performance report. Here, you’ll find information about the keywords your site is ranking for, including their average position, impressions, and click-through rates.
If you prefer manual checks, disable personalised search in your browser and search for your target keywords directly on Google to see where your site appears. For even more insights, you can explore tools like Bing Webmaster Tools or free versions of popular SEO platforms. These resources can give you additional data to refine and improve your website’s visibility in search results.


